// BOURNEMOUTH365
Bournemouth, Christchurch & Poole — live, right now
Buses, flights, road closures, river levels and flood warnings, sea water quality, bike bays and the latest satellite pass, each drawn from a named public feed onto one map — free on the flat map, with the 3D city loaded only when you ask for it.
- ● Measured, not modelled
- ● Free flat map, 3D on request
- ● No ads, no paywall
// THE FEEDS, RIGHT NOW
What the map is reading at this moment
These are the same feeds the map itself reads, fetched from our own server when you opened this page. Times are in your local time; hover a time for the exact UTC stamp. A feed that does not answer says so — nothing here is filled in from memory.
What the feeds reported when this page was served, at 09:36 on Monday 19 October 2026: no Environment Agency flood warnings or alerts in force, which is not the same as no flood risk; 46 of 50 Environment Agency river and tide gauges reporting; 0 of 132 monitored storm overflows discharging (Wessex Water and Southern Water monitors), with all 24 designated beaches on a normal pollution-risk forecast (Environment Agency); and the latest Sentinel-2 satellite pass on 17 October 2026 (1% cloud).
Buses tracked now in and around Bournemouth, Christchurch and Poole. Waiting for the feed… if this stays, the feed is down and we would rather say so than guess.
updated —
River and tide gauges in the area with a reading; the Environment Agency publishes on roughly a 15-minute cycle.
updated 09:35
Flood warnings and alerts in force for the area. No active warnings is not the same as no flood risk. Check the Environment Agency’s own warnings page before you act on this.
updated 09:35
24 designated beaches from Poole Harbour to Christchurch Bay: all on a normal pollution-risk forecast from the Environment Agency today. 0 overflows discharged in the last 48 hours. Their published status, not a verdict on swimming — the map links each beach to its Swimfo page.
updated 09:35
Closures signed on the National Highways network nearby, which here means the A31. Waiting for the feed…
updated —
Aircraft transmitting a position within range of the centre of the map. Waiting for the feed…
updated —
Most recent Sentinel-2 scene over the area, captured 12:10 on that date — 1% cloud cover. Contains modified Copernicus Sentinel data 2026.
updated 04:45
3D city views left today. Google bills each one to us, so the 3D city loads only when someone asks for it.
updated —
Chips: MEASURED is an instrument or transponder reporting; OFFICIAL STATUS is a public body’s own published state; COMPUTED is arithmetic we do ourselves.
// THE MAP
Open the Bournemouth365 live map
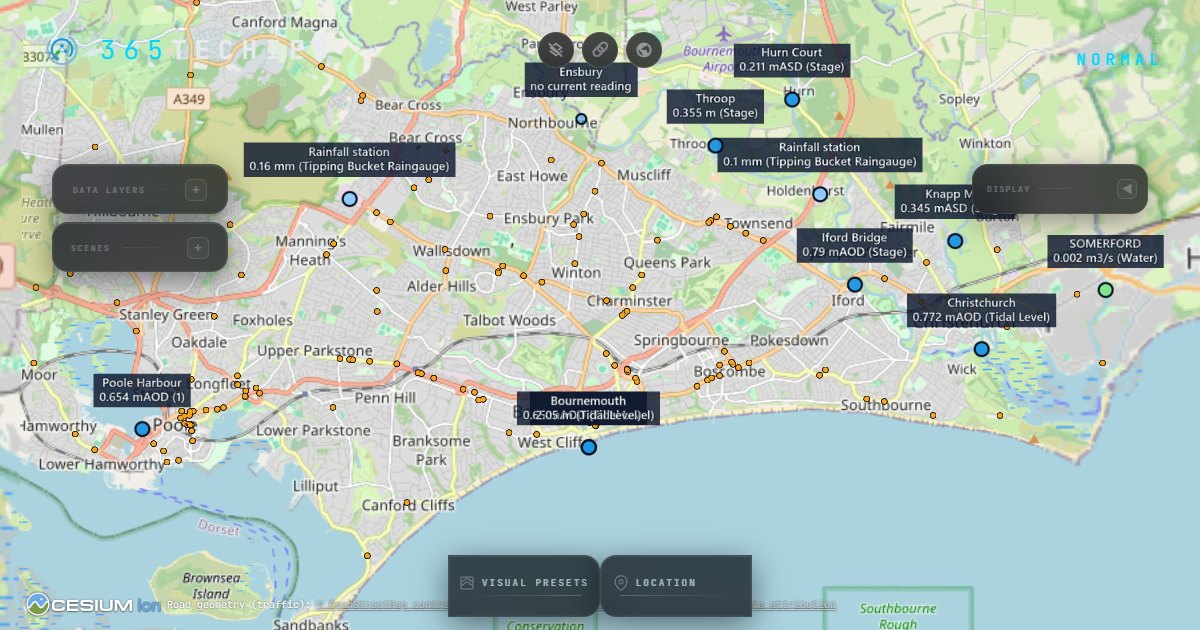
The map opens right here, on top of this page, and closes with the button at the top or the Escape key. It is a heavier download than the rest of Bournemouth365 — about 2.3 MB compressed on first open, most of it the CesiumJS map engine, plus the map tiles as you pan — which is exactly why it loads only when you open it, never on arrival. It opens on the free OpenStreetMap flat map with every live layer working; the 3D city is a separate button inside the map.
No JavaScript? Open the map app directly instead.
What you are seeing
Every layer on the Bournemouth365 live map is a named public feed drawn where it says it is. Nothing is modelled, interpolated or guessed; where a feed goes quiet the layer says so instead of holding its last value.
Buses. Vehicle positions from the Department for Transport’s Bus Open Data Service — the same feed the operators publish for their own apps. Our server re-reads it every 12 seconds and the map moves the buses every 15. A bus that stops reporting is dropped after four minutes rather than left parked on the map.
Flights. Aircraft transmitting ADS-B, received by the adsb.lol community network and read every 25 seconds. It is what is being received, not the airport’s schedule: an aircraft nobody is receiving is not on the map.
Road closures and planned works. National Highways’ own feeds for its network, read every minute. Around here that network is the A31: the A338 Wessex Way and the A35 through Poole, Bournemouth and Christchurch are BCP Council’s roads, so their closures are not in this feed. It also reports only closures that are signed on the road, so an empty list means nothing is signed, not that every road is clear.
Traffic. The road geometry is OpenStreetMap. Colouring a road with live congestion needs measured flow data — ours is TomTom’s traffic flow, credited on the map whenever it is drawn — and a road we have no measured flow for is left uncoloured, never coloured from a guess.
River levels and flood warnings. The Environment Agency’s real-time data API: river and tide gauges on the Stour, Avon and the harbour report on roughly a 15-minute cycle, and flood alerts and warnings are re-read every five minutes. No active warnings is not the same as no flood risk.
Bike bays. The Beryl BCP scheme’s public GBFS feed — bay locations and how many bikes are docked, read every three minutes.
The latest satellite pass. The most recent Sentinel-2 scene over the area from the Copernicus Data Space Ecosystem, with its capture date and cloud cover. Sentinel-2 revisits every few days, and our server checks for a new scene every six hours — so this layer is days old by design, and its date says so.
Mobile signal. The community speed tests from our own signal checker — real phone tests submitted by the public, drawn as grid cells holding the median download speed of the tests taken inside each one. These are phone speed tests, not radio measurements: there is no signal-strength reading behind them. A cell stays a quiet grey outline until enough tests have been taken in it — five on the coast, eight inland — and says how many more it needs, which is an invitation rather than a verdict. It aggregates across all networks by design and compares no operators. Our van’s own drive-test readings are a separate dataset, published under CC BY 4.0 on the mobile signal map.
The 3D city. Google’s Photorealistic 3D Tiles, loaded only when you press the 3D button inside the map — see below for why.
Where the data comes from
Each feed keeps its own licence, and several require particular wording. The wording below is copied exactly from the map’s own credits.
| Source | What it supplies | Licence | Attribution, as required |
|---|---|---|---|
| DfT Bus Open Data Service | Live bus positions | Open Government Licence v3.0 | Contains public sector information licensed under the Open Government Licence v3.0 |
| Environment Agency real-time data API (Beta) | River levels, tide gauges, flood warnings | Open Government Licence v3.0 | Dorset water & flood data: uses Environment Agency flood and river level data from the real-time data API (Beta) — © Environment Agency, Open Government Licence v3.0 |
| Environment Agency bathing water quality (Swimfo) | Today’s pollution-risk forecast, annual classification and heavy-rain flag for every designated beach in the area | Open Government Licence v3.0 | Bathing water status: Environment Agency bathing water quality data — © Environment Agency, Open Government Licence v3.0 |
| Wessex Water and Southern Water Storm Overflow Activity via Stream | Near-real-time storm overflow status for monitored outfalls: discharging, not discharging, monitor offline, and the last event times | CC BY 4.0 | Storm overflow activity: © Wessex Water and © Southern Water, CC BY 4.0, via Stream — relayed as published, never our verdict |
| National Highways Transport Data Feeds | Road closures (DATEX II) and planned works | National Highways developer-portal terms (OGL-based); the wording is a condition of use | Powered by National Highways' Transport Data Feeds. Planned works: © National Highways — Contains public sector information licensed under the Open Government Licence v3.0 |
| Beryl BCP GBFS feed | Bike hire bays and availability | CDLA-Permissive-2.0 | Beryl BCP scheme GBFS feed (CDLA-Permissive-2.0) |
| adsb.lol | Flights and aircraft traces (ADS-B) | ODbL 1.0 | adsb.lol (ODbL 1.0) |
| Re:Earth Terrain / Mapterhorn | The ground relief under the flat map, streamed keyless as the map opens (about 4 MB for the opening view) | CC BY 4.0 | Terrain (keyless globe stacks): Re:Earth Terrain / Mapterhorn (CC BY 4.0) / EGM2008 (NGA) |
| OpenStreetMap | The free flat basemap, and the road geometry the traffic layer draws on | ODbL 1.0 and the OSMF tile usage policy | © OpenStreetMap contributors (ODbL 1.0) — shown on screen while the tiles show |
| TomTom Traffic API | Live congestion colouring, only on roads where flow is measured | TomTom for Developers terms (commercial use permitted) | Traffic flow data © TomTom — in the map’s credits whenever live flow is drawn |
| Copernicus Sentinel-2 L2A via the Copernicus Data Space Ecosystem | The latest satellite pass | Copernicus Sentinel Data Legal Notice | Contains modified Copernicus Sentinel data [Year] — [Year] is the year the scene was captured, filled in when the scene metadata arrives |
| Google Photorealistic 3D Tiles | The 3D city, only after you press the 3D button | Google Maps Platform terms | Google’s own attribution, rendered on screen by the map’s credit line while 3D is showing |
| 365 Techies community signal tests | Mobile signal — median download speed from community phone tests | 365 Techies’ own data — aggregated cells only, not published for reuse | 365 Techies community · 365techies.co.uk/signal |
| Software | The map application and its engine | God’s Eye View (MIT) on CesiumJS (Apache-2.0) | Software: built on God's Eye View © 2026 Bilawal Sidhu (MIT); CesiumJS (Apache-2.0) and other open-source components — third-party notices |
Why 3D asks first
Google bills the 3D city per view. The map therefore opens on the free OpenStreetMap flat map with every live layer already working, and the 3D city loads only when someone asks for it. There are 30 3D views a day across everyone who visits; the counter at the top of this page shows how many are left, and when they are gone the 3D button inside the map says so and comes back after midnight UTC. Nothing else on the map is metered.
Works on a phone, but
The map is a heavier download than the rest of Bournemouth365: about 2.3 MB compressed on first open, most of it the CesiumJS engine, and then map tiles as you move around. It runs on a modern phone (iPhone 6s and newer, and any current Android), and it notices what it is running on: phones, and laptops without a dedicated graphics chip, get a lighter setting that loads the 3D city in about half the time with the same picture. Open it on Wi-Fi or good 4G rather than on a thin signal on the beach, and expect the 3D city to be the part that asks most of an older device. There is a camera button in the top bar for a picture of your view that you can save or share, with the place, the time and the data sources printed on it. The rest of this page, including the live counts at the top, is as light as every other Bournemouth365 page.
// GOOD QUESTIONS
Frequently asked
Is the Bournemouth live map really live?
Yes. Every layer polls a named public feed while the map is open, and the counts at the top of this page are fetched from the same feeds when the page loads, each with the time its feed last answered. When a feed does not answer, its tile says feed offline and shows no number — an old value is never shown as a fresh one.
How often does each layer update?
Buses: the feed is re-read every 12 seconds and the map moves them every 15. Flights: every 25 seconds. Road closures: every minute. Flood warnings: every five minutes. River and tide gauges: on the Environment Agency’s own cycle of roughly 15 minutes. Bike bays: every three minutes. The satellite scene changes only when Sentinel-2 passes over again, every few days, and we check for a new one every six hours.
Why are there no traffic colours on some roads?
Because colouring a road needs measured flow data for that road, and ours comes from TomTom’s traffic API. The road geometry itself is OpenStreetMap; where TomTom reports no flow for a road, it stays uncoloured rather than being coloured from a guess. The map’s strapline is measured, not modelled, and that applies to traffic too.
Why does the 3D city ask before it loads?
Google bills the 3D city per view, so the map opens on the free OpenStreetMap flat map with every live layer working and loads the 3D city only when someone presses the button. There are 30 3D views a day in total; when they are gone the button says so, and the count resets after midnight UTC.
Does the map track me?
No. There is no account, the map sets no cookies and runs no analytics of its own, and at the time of writing it never asks for your location. It remembers which layers you switched on in your own browser’s storage and nowhere else. The live counts on this page come from our own server, which reads the public feeds on your behalf.
Will it work on my phone?
Yes, on a modern phone, but it is a heavy download compared with the rest of Bournemouth365 — about 2.3 MB compressed on first open, most of it the CesiumJS engine, and then map tiles. Open it on Wi-Fi or good 4G. The map picks a lighter setting on phones; the 3D city is still the part that asks most of an older device.
Does the map tell me whether it’s safe to swim?
No — and nothing honest can, from a desk. What the sea water layer shows is two published facts, each named for who published it: the Environment Agency’s daily pollution-risk forecast for every designated beach from Poole Harbour round to Christchurch Bay (normal or increased, with the time it expires, plus the beach’s annual classification), and the water companies’ own near-real-time reports of which storm overflows are discharging and which discharged in the last two days. A forecast leaves the map the moment it expires, and an overflow report its company has not updated for three hours is marked unconfirmed rather than left looking current. After heavy rain, check the Environment Agency’s Swimfo page for the beach before you go in — the map links to it.
// BOURNEMOUTH365
Bournemouth, 365 days a year
These pages are the web home of our Bournemouth365 Facebook page, where 39,000 of you watch the seafront with us every day. Here: the seafront’s weather, tide times and rain radar, the sea measured live, an honest guide to beach parking, and the best sunrise and sunset spots — photographed by us, not stock.
Bournemouth365 home · Weather, tides & radar · Live map: traffic, buses, sea · The sea right now · Friday fireworks · Sunrise & sunset · Beach parking · Fuel prices · Mobile signal map · Seafront: the game
Built in Bournemouth by 365 Techies — the family firm that has looked after the town’s computers since 1995.
No ads. No paywall. No consent wall. Built to load fast on beach 4G.