// OUR OWN BUILD
We built a live measurement platform — and gave it to the town
Coverage checkers are predictions. So we built the thing that measures: a ten-second signal test that runs in any phone’s browser and fills in a live public map, square by square. 2659 readings across 768 squares so far (as of 2026-09-08) — designed, built and run by 365 Techies in Bournemouth.
Rated 4.9 on GoogleFamily-run since 1995 · real people, no call centre// THE BUILD
What it took to make ten seconds feel simple
The rule was: no app, no sign-up, nothing to learn. Everything below exists so that a stranger on Facebook can tap once and be on the map ten seconds later.
A real measurement, in the browser
A streamed download test with a live gauge, GPS-accuracy gating (a vague fix can’t buy street-level precision), and honest error messages. Works on any modern phone.
Privacy as architecture
No accounts. Your exact position exists for one instant on the server and is replaced by the centre of a ~500 m square (~140 m on the seafront). Nothing stored can identify a phone or a home.
Our own maps, not Google’s
The whole UK, served from map tiles we host ourselves — no third-party map service, no per-view fees, no tracking scripts riding along.
Verification people can see
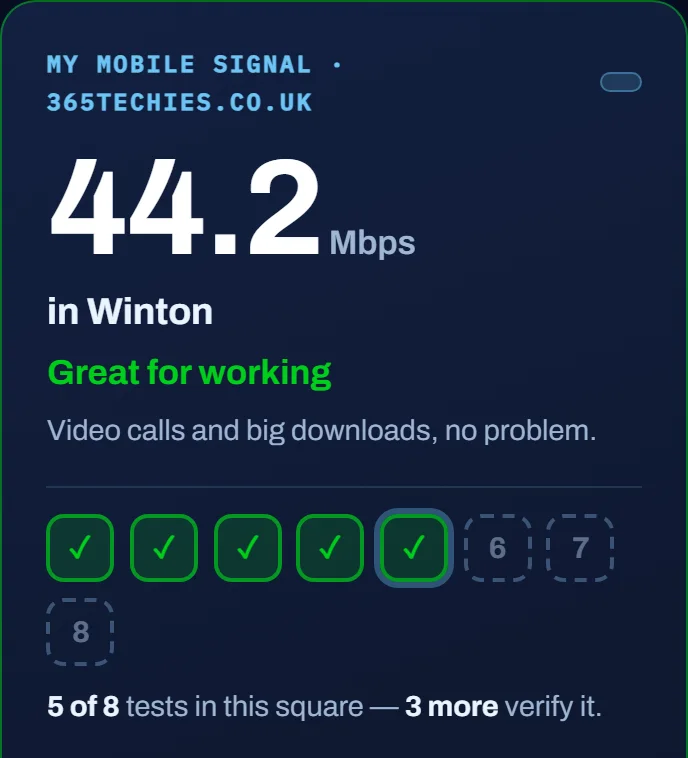
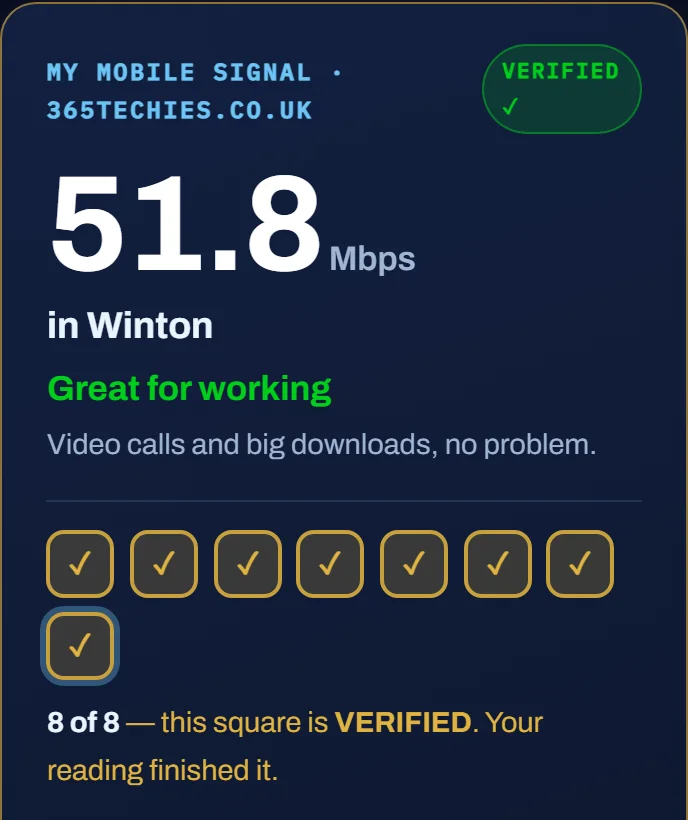
A square is only verified at 8 readings (5 on the finer seafront grid). The result card shows it as a stamp strip — and the reading that tips a square over the line goes gold, with confetti.
Sharing that grows a chain
Every shared result carries a challenge — “beat 44 Mbps in Winton” — and a visible chain that gets longer with every phone. Forged links are ignored; nothing shared ever names a network.
A dataset that stays ours
Every verified square lives in one clean, dated dataset we own outright — the town pages on this site update themselves from it, and the underlying figures are ready to put in front of a council or a journalist when it counts.
// THE DAY IT TOOK OFF
23 August 2026: Poole, 0 to 24 verified squares
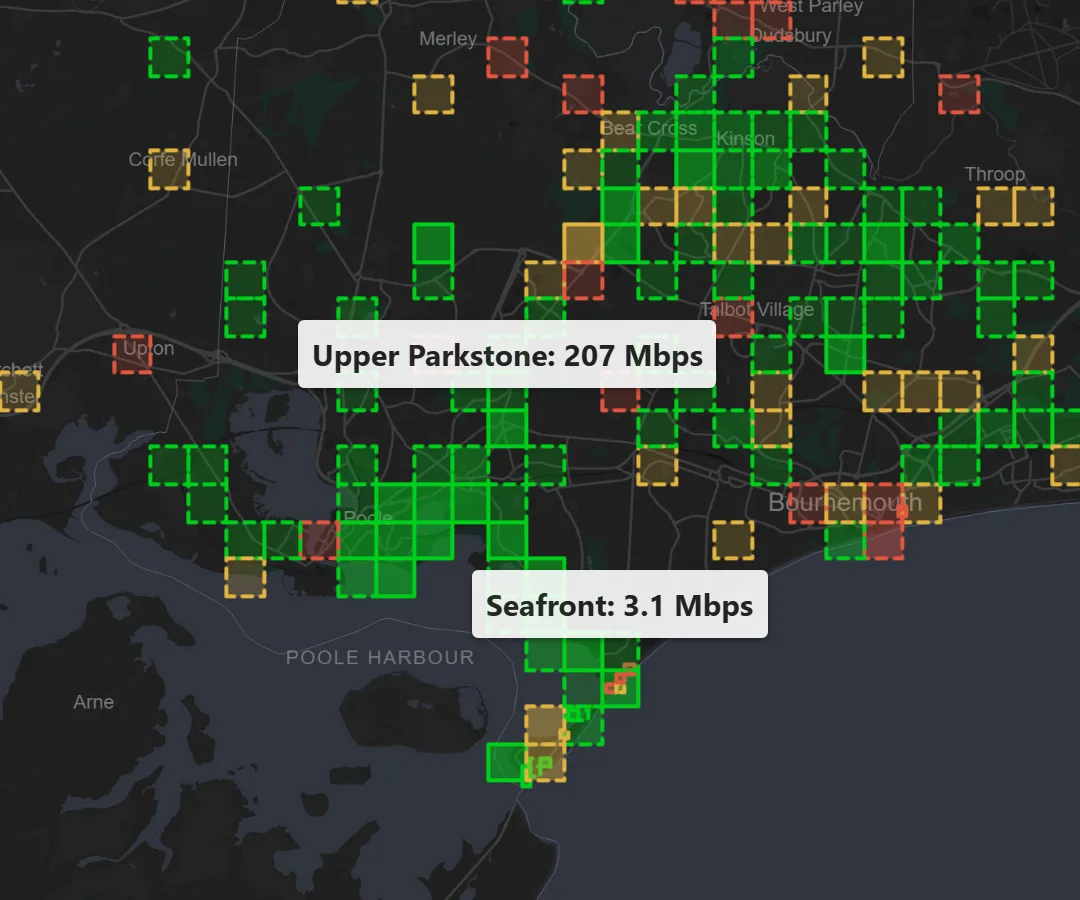
The day after we shipped share challenges and a one-minute retest gap, the map went from 316 readings to 958 in 24 hours. Poole went from 23 readings and nothing verified to 489 readings and 24 verified squares — people walked it, Sandbanks to Canford Heath. The contrast the data showed: Upper Parkstone medians 207 Mbps while a Canford Cliffs seafront square manages 3.1 — a 67× gap inside one town that no prediction map shows.
// THE EXPERIENCE
Small details, deliberately
The stamp strip answers “how many tests does a square need?” without a sentence — and the reading that finishes a square gets a moment worth sharing.
// THE POINT
If we can build this for a town, we can build yours
Everything on this page — the product thinking, the web app, the live data, the maps, the privacy design, the automation that keeps it all current — is the same work that goes into customer portals, booking systems, monitoring dashboards and AI tools for local businesses. The signal map is our proof, running in public, measurable by anyone. Most agencies show you mock-ups; we can show you a live platform the town actually uses.
// GOOD QUESTIONS
Frequently asked
What is the signal map, in one sentence?
A free ten-second test that measures the real mobile-data speed on your phone where you stand, and adds it to a public map as a ~500 m square — try it here.
Did you really build all of this yourselves?
Yes — the browser test, the measurement store, the map (self-hosted map tiles, no Google Maps), the share challenges, the dataset and the town-page integration. It runs on our own infrastructure.
Could you build something like this for my business?
That is why this page exists. The same skills — web apps, live data, maps, dashboards, automation and AI — apply to booking systems, customer portals, monitoring dashboards and data tools. Start with our AI services or web design & hosting, or just ring us.
Who owns the data?
We do. Individual readings are anonymous by design and the published map shows squares and medians — nothing finer. We share the underlying figures with councils, researchers and journalists case by case, and we never publish network-vs-network league tables.
Got a tool, portal or data idea for your business?
Tell us what you wish existed — a dashboard, a booking flow, a customer portal, an AI assistant. We will tell you honestly what it would take, and show you this map as our reference.
01202 775566 · help@365techies.co.uk · MON–FRI 9AM–5PM